Biden’s Numbers, April 2024 Update
Este artículo estará disponible en español en El Tiempo Latino.
Summary
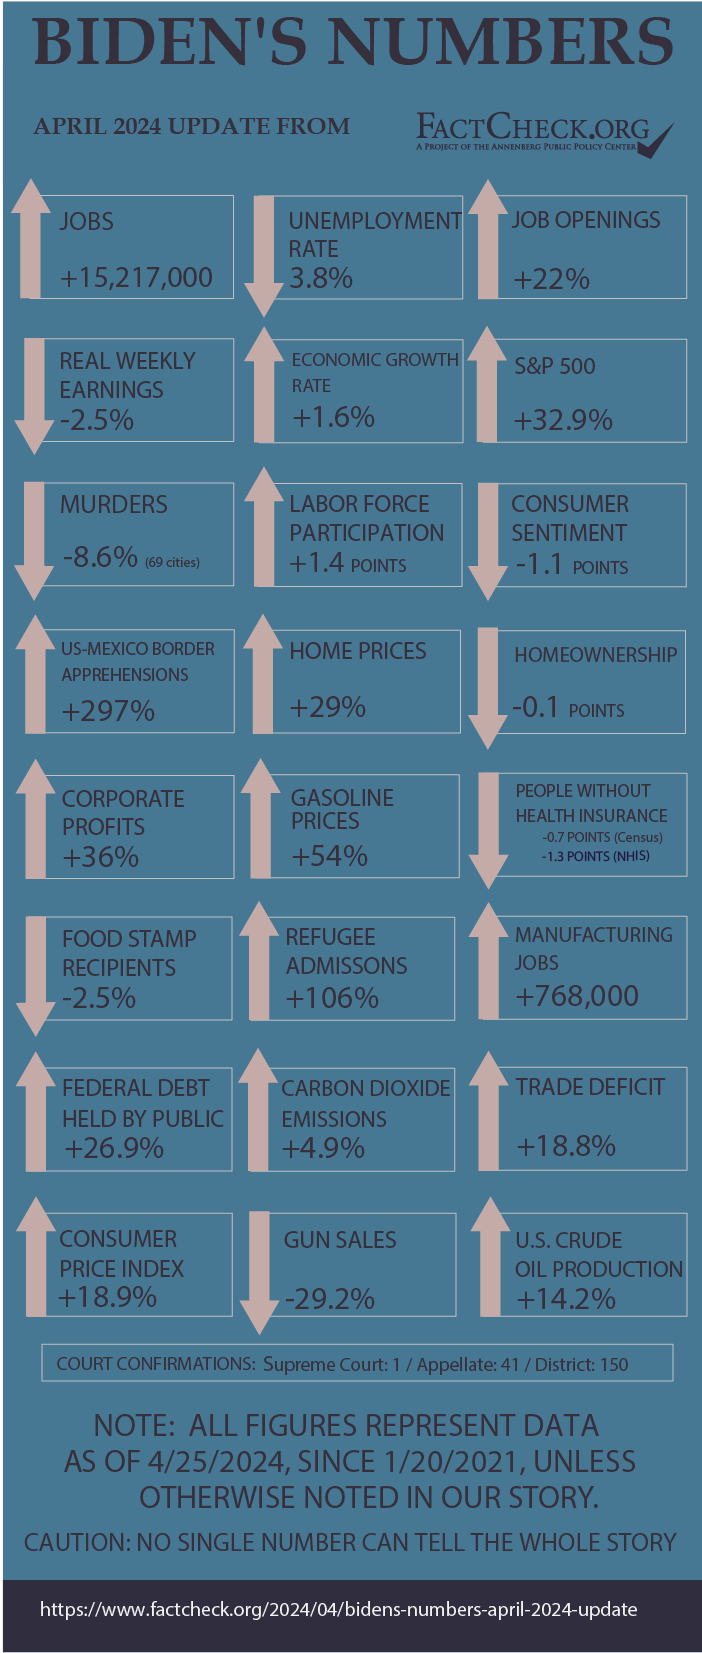
As President Joe Biden runs for reelection, here’s how the U.S. has fared during his time in office:
The economy added 15.2 million jobs. The number is now nearly 6 million higher than before the pandemic.
The unemployment rate dropped back and has stayed lower, longer than at any time during the previous administration.
The U.S. economy has expanded each year under Biden and is expected to continue to grow this year, although the first quarter estimate for this year was below expectations.
Inflation surged to its highest level in over 40 years. Despite recent moderation, consumer prices are up nearly 19% overall. Gasoline is up 54%.
Average weekly earnings haven’t kept pace with prices. After adjusting for inflation, “real” weekly earnings dropped 2.5%.
The number of people receiving food stamps has decreased by more than 1 million.
The S&P 500 has increased 32.9%.
Apprehensions of those trying to cross the southern border illegally are up 297% for the 12 months ending in March.
Crude oil production is up 14.2%; imports are up 10.8%.
Violent crime has gone down. The latest figures from large cities show an 8.6% drop in murders.
The publicly held debt has increased by roughly 27%.
The trade deficit for goods and services is about 18.8% higher.
For fiscal year 2024, the administration is on pace to admit the most refugees in nearly three decades.
Analysis
In the fall presidential election, Biden will likely face his predecessor, Donald Trump. As we did for Trump, we’ve compiled on a quarterly basis the latest statistics that provide a measure of how things have changed under Biden’s time in office.
This is our ninth quarterly update of “Biden’s Numbers,” which we first published in January 2022. We plan to publish two more updates before Election Day, in July and October.
Jobs and Unemployment
The number of people with jobs rebounded strongly during Biden’s time, surpassing pre-pandemic levels by almost 6 million.
Employment — The U.S. economy added 15,217,000 jobs between Biden’s inauguration and March, the latest month for which data are available from the Bureau of Labor Statistics. The March figure is 5,824,000 higher than the February 2020 peak of employment before COVID-19 forced massive shutdowns and layoffs.
Some areas are still lagging, however. In March, there were only 23,000 more local government education workers, including teachers, than there were at the pre-pandemic peak, and reports of teacher shortages persist. Employment in the leisure industry still hasn’t recovered; there were 151,000 fewer hotel and restaurant workers and others in the accommodation and food services industries in March than before the pandemic.
Unemployment — The unemployment rate has been lower for longer under Biden than under his predecessor.
It hit the lowest point in over half a century in January 2023 and again in April 2023, when it was 3.4%, the lowest since June 1969.
This March also marked the 28th consecutive month that the rate was at or below 4%. The longest such stretch under Donald Trump was 24 months, just before the pandemic sent the unemployment rate soaring.
The rate was 3.8% last month, down 2.6 percentage points since Biden took office.
Job Openings — The number of unfilled job openings soared, reaching a record of over 12 million in March 2022, but then declined after the Federal Reserve began a steep series of interest rate increases aimed at cooling the economy to bring down price inflation.
The number of unfilled jobs was nearly 8.8 million as of the last business day of February, the most recent month on record. That’s still an increase of nearly 1.6 million openings — almost 22% — compared with January 2021, when Biden took office.
In February, there was an average of nearly 1.4 jobs for every unemployed job seeker. When Biden took office, it was the other way around — fewer openings than unemployed job seekers.
The number of job openings in March is set to be released May 1.
Labor Force Participation — The labor force participation rate (the percentage of the total population over age 16 that is either employed or actively seeking work) has risen slowly during Biden’s time, from 61.3% in January 2021 to 62.7% in March.
That still leaves the rate about half a percentage point short of the pre-pandemic level of 63.3% for February 2020.
The rate has been trending generally down for nearly a quarter of a century. It peaked at 67.3% during the first four months of 2000. Labor Department economists project that the rate will continue to slide down to 60.1% in 2031, “primarily because of an aging population.”
Manufacturing Jobs — During the presidential campaign, Biden promised he had a plan to create a million new manufacturing jobs — but that hasn’t yet been achieved.
As of March, the U.S. added 768,000 manufacturing jobs during Biden’s time, a 6.3% increase in the space of 38 months, according to the BLS.
But compared with the highest level during Trump’s time in office — which was January 2019 — manufacturing jobs are up only 128,000, or 1%.
Wages and Inflation
CPI — Inflation came roaring back under Biden. During his first 38 months in office, the Consumer Price Index rose 18.9%.
For a time it was the worst inflation in decades. The 12 months ending in June 2022 saw a 9.1% increase in the CPI (before seasonal adjustment), which the Bureau of Labor Statistics said was the biggest such increase since the 12 months ending in November 1981.
Inflation has moderated more recently. The CPI rose 3.5% in the 12 months ending in March, the most recent figure available.
Gasoline Prices — The price of gasoline shot up even faster.
During the week ending April 22, the national average price of regular gasoline at the pump was $3.67. That’s $1.29 higher than in the week before Biden took office, an increase of 54%.
The price swung wildly during Biden’s first year and a half, hitting just over $5 per gallon in the week ending June 13, 2022. That’s the highest on record. The rise was propelled by worldwide supply and demand issues due to the COVID-19 pandemic and then by Russia’s invasion of Ukraine on Feb. 24, 2022.
Wages — Wages also have gone up under Biden, but not as fast as prices.
Average weekly earnings for rank-and-file workers went up 16.6% during Biden’s first 38 months in office, according to monthly figures compiled by the BLS. Those production and nonsupervisory workers make up 81% of all employees in the private sector.
But inflation ate up all that gain and more. In March “real” weekly earnings, which are adjusted for inflation and measured in dollars valued at their average level in 1982-84, were still 2.5% below where they were when Biden took office.
That’s despite months of recent improvement. Real earnings in March were 2.1% higher than in June 2022, the low point under Biden.
Economic Growth
Despite concerns about high inflation and the Federal Reserve’s policy of raising interest rates to slow inflation, the U.S. economy has expanded each year under Biden and is expected to continue to grow this year — although the first quarter estimate for this year was below expectations.
The real gross domestic product (which is adjusted for inflation) increased 5.8% in 2021, 1.9% in 2022 and 2.5% last year. In the first quarter of this year, the economy grew at an annual rate of 1.6%, the Bureau of Economic Analysis said in an April 25 release announcing its “advance estimate.” (The advance estimate is the BEA’s first estimate, which could be adjusted May 30 when the second estimate is released.)
The 1.6% first quarter estimate was far below expectations. A day earlier, the Federal Reserve Bank of Atlanta’s GDPNow model was projecting growth of 2.7%. The BEA said the first-quarter figure reflected a slowdown in spending.
“Compared to the fourth quarter, the deceleration in real GDP in the first quarter primarily reflected decelerations in consumer spending, exports, and state and local government spending and a downturn in federal government spending,” the BEA said in its release.
Prior to the release of the first-quarter estimate, economists had become increasingly more positive about the U.S. economy in 2024.
In mid-April, Bloomberg News surveyed 71 economists and found that they “now see gross domestic product expanding by 2.4% on average in 2024, up from 2.2% in last month’s survey.”
Similarly, the International Monetary Fund this month upgraded its forecast for U.S. growth this year to 2.7%, up from 2.1% in January. And Vanguard said in its April economic outlook that it expects “real (inflation-adjusted) U.S. economic growth of about 2% in 2024, higher than our initial estimate of about 0.5%.”
Crime
Violent crime has gone down over Biden’s time in office.
Preliminary figures from the FBI show a 5.7% drop in violent crimes and a 13.2% decline in the number of murders from 2022 to 2023, based on data from 79% of law enforcement agencies in the U.S. (download the quarterly tables to see these figures). All other categories of crime also declined, including property crime overall, with the exception of motor vehicle thefts, which increased by 10.7%.
The FBI figures are based on voluntary reports by agencies nationwide. We won’t have the final numbers or information about the nationwide crime rates, which are adjusted for population, until the FBI’s annual crime report is released later this year.
The 2022 annual report showed a slight decline in the nationwide murder and nonnegligent manslaughter rate of 0.5 points from 2020, the year before Biden took office, to 2022. The violent crime rate dropped by 15.4 points, to 369.8 per 100,000 population in 2022.
The property crime rate also decreased during that time period, by 9.5 points. As with the more recent preliminary data, there was an increase in motor vehicle thefts, by 35.2 points. (For these figures, see Table 1 in the CIUS Estimations download for the crime in the U.S. reports.)
The latest figures from the Major Cities Chiefs Association also show a decline in murders and violent crime. The number of murders has gone down by 10.4% from 2022 to 2023 in 69 large U.S. cities. Since 2020, murders in those cities have dropped by 8.6%.
(Note: New York City isn’t included in those percentages, because its 2023 statistics are not in the latest Major Cities Chiefs Association report. However, the number of murders citywide declined by 16.5% from 2020 to 2023, according to data posted by the New York Police Department. The decrease from 2022 to 2023 was 10.7%.)
Despite the decline, the number of murders still isn’t back down to the level in 2019, before a sizable increase occurred. From 2019 to 2020, according to the Major Cities Chiefs Association, there was a 33.4% increase in the number of murders in large cities. In Biden’s first year in office, there was a much smaller uptick of 6.2%. Since 2021, the numbers have been going down.
So far in 2024, murders in more than 200 U.S. cities have declined by 20% overall, compared with the same point last year, according to figures compiled by AH Datalytics, an independent criminal justice data analysis group.
Trade
The U.S. goods and services deficit was $775.9 billion over the last 12 months through February, according to figures published by the Bureau of Economic Analysis earlier this month. The trade deficit in that period was about $123 billion higher, or about 18.8% more, than in 2020.
The international trade gap in the most recent 12-month period is about $3.9 billion less than the calendar year 2023 deficit of $779.8 billion. Last year’s trade deficit was the first annual decrease under Biden — dropping more than 18% from the record gap of nearly $951.2 billion in 2022.
The BEA said the deficit went down in 2023 because of an increase in exports of services, such as travel and transport, and a decrease in the import of goods, such as industrial supplies and materials.
Food Stamps
The number of people receiving food stamps has decreased during Biden’s time by more than 1 million.
As of January, the most recent figures available, there were 41.1 million beneficiaries receiving food assistance through the Supplemental Nutrition Assistance Program, according to preliminary statistics from the Department of Agriculture published April 12.
That puts SNAP enrollment about 1.1 million below where it was when Biden took office.
In percentage terms, the decline is just over 2.5%.
At the current level, 12.2% of the U.S. population was receiving food aid in January, or just under 1 out of every 8 people.
Health Insurance
The number and percentage of people lacking health insurance has dropped under Biden, and millions more have enrolled in Affordable Care Act marketplace plans.
Since our last report, we have just one more quarter of data on the uninsured from the National Health Interview Survey In the third quarter of 2023, 7.7% of the population was uninsured. That’s a half of a percentage point increase from the second quarter but the same rate as the first quarter.
So far, the quarterly data for 2023 indicate there was a decrease in the uninsured again that year. In 2020, 9.7% of the population or 31.6 million people were uninsured, according to the NHIS. In 2022, 8.4% or 27.6 million people were uninsured. That’s a decrease of 1.3 percentage points or 4 million people under Biden.
The NHIS, a project of the National Center for Health Statistics at the CDC, measures the uninsured at the time people were interviewed.
The Census Bureau’s annual reports, which measure those who lacked insurance for the entire year, show the uninsured decreased by 0.7 percentage points or 2.4 million people from 2020 to 2022. We won’t have the 2023 annual report for several more months.
As we have been noting, it’s possible the uninsured figures will start to rise, since some Medicaid provisions that were enacted during the coronavirus pandemic started to be phased out at the end of March 2023.
Under Biden, the premium subsidies for the Affordable Care Act’s marketplace plans have increased — first, through the American Rescue Plan for two years and then through the Inflation Reduction Act. The expanded subsidies are set to expire at the end of 2025. The more generous subsidies allow those earning up to 150% of the federal poverty level to get an insurance plan for $0. (People are eligible for subsidies at 100% of the poverty level, or 138% in states that adopted the Medicaid expansion.) The ACA’s subsidy cap at 400% of the poverty level also has been lifted — those earning more can get subsidies but have to contribute up to 8.5% of their income toward their premiums, as the health policy research organization KFF has explained.
Since 2020, enrollment in the ACA’s marketplace plans has gone up by 10 million people. In the 2024 open enrollment period, 21.4 million people signed up for an insurance plan or were automatically reenrolled.
Stock Markets
As we noted in our last report, the stock markets finished last year strong and started this year strong.
The S&P 500, which is made up of 500 large-cap companies, set new highs in late January, closing on Jan. 24 at a high of 4,868.55. On March 28, the final trading day of the first quarter, the S&P reached a new high at 5,254.35, and recorded its best quarter since 2019.
April has been a cruel month for some investors, but overall all three markets have seen double-digit gains under Biden.
At the close on April 25, the S&P 500 was 5,048.42 — down from its peak in March, but still 32.9% higher than what it was when Biden took office on Jan. 20, 2021.
The Dow Jones Industrial Average, which includes 30 large corporations, has seen smaller gains than the S&P 500. It has increased 23.1% under Biden — not much different from our last report.
Like the Dow, the technology-heavy NASDAQ composite index, which is made up of more than 3,000 companies, has experienced little change since our last report. Overall, it was up 18.3% under Biden, closing at 15,611.76 on April 25.
Consumer Sentiment
In our January report, consumer confidence in the economy showed some signs of life. But, since then, it has leveled off.
The University of Michigan’s Surveys of Consumers reported that its final Index of Consumer Sentiment for January was 79 — the highest since July 2021. The preliminary survey results for April were little changed at 77.9.
“Since January, sentiment has remained remarkably steady within a very narrow 2.5 index point range, well under the 5 points necessary for a statistically significant difference in readings,” Joanne W. Hsu, director of the Surveys of Consumers, said in a press release on the April preliminary results. “Consumers perceived little change in the state of the economy since the start of the new year.”
Hsu cited a “slight uptick in inflation” and the looming 2024 election as reasons why consumers have tempered their views of the U.S. economy.
Still, the preliminary April figure is 27.9 points higher than the low under Biden, which occurred in June 2022. It is now nearly back to where it was when Biden took office in January 2021, when the index was 79, the historical survey data show.
The Conference Board’s Consumer Confidence Survey also reported little change in March, and warning signs that consumers were becoming “more pessimistic about the future.”
Debt and Deficits
Debt — Since our last quarterly update, the public debt, which excludes money the government owes itself, has increased to about $27.5 trillion, as of April 23. That is more than $5.8 trillion, or roughly 27%, higher than the public debt was when Biden took office.
Deficits — The budget deficit for fiscal year 2024 is a little less than it was at the same point in fiscal 2023, according to the Congressional Budget Office.
Through the first six months of this fiscal cycle (October to March), the deficit was $1.1 trillion, or “$37 billion less than the deficit recorded during the same period last fiscal year,” the CBO said in its Monthly Budget Review published this month. The nonpartisan agency said the difference is partially due to higher revenue this fiscal year, but also a shift in when some scheduled payments were made during the previous fiscal year.
For now, the nonpartisan agency projects that the total budget gap for fiscal 2024 will be $1.5 trillion — down from the nearly $1.7 trillion deficit in fiscal 2023.
Corporate Profits
After two record-setting years under Biden, after-tax corporate profits dipped slightly in 2023.
For the year, after-tax corporate profits set records in 2021 and 2022, according to BEA estimates. (See line 45.)
The BEA estimated that profits in 2023 were $2.97 trillion — slightly lower than $2.98 trillion in 2022. Still, it was 36% higher than in 2020, the year before Biden took office.
The preliminary estimate of after-tax corporate profits for the first quarter of 2024 will be released May 30.
Refugees
Biden may fall short again of his ambitious campaign promise to accept up to 125,000 refugees a year into the U.S. But his administration is on course to admit the most refugees in nearly three decades.
On Sept. 29, the Biden administration set the cap on refugee admissions for fiscal year 2024 at 125,000 – just as it did in fiscal years 2023 and 2022.
The administration admitted only 25,465 refugees in FY2022 and 60,014 in FY2023. In the first six months of FY2024, the U.S. has admitted 48,673 refugees, according to State Department data.
At the current pace, the Biden administration appears unlikely to reach 125,000 refugees, but it is likely to register the highest number of refugees since 1995, when the Clinton administration admitted nearly 100,000 refugees, according to data compiled by the Migration Policy Institute.
“Legal immigration is returning to and in some cases surpassing pre-pandemic levels, including refugee admissions on pace to reach the highs of the 1990s,” the Migration Policy Institute said in a January article on Biden’s immigration policies after three years.
In a November report to Congress, the State Department credited the Biden administration’s “intensive efforts to restore, strengthen, and modernize the U.S. Refugee Admissions Program” as the reason for making “significant progress” toward Biden’s goal for refugee admissions.
Overall, the U.S. has admitted 144,160 refugees in Biden’s first full 38 months in office, or nearly 3,800 refugees per month, the department’s data show. That’s 106% higher than the 1,845 monthly average under Trump, who drastically reduced the admission of refugees. The Trump administration admitted only 86,731 refugees in four years. (For both presidents, our monthly averages include only full months in office, excluding the month of January 2017 and January 2021, when administrations overlapped.)
Illegal Immigration
The number of apprehensions of those trying to cross the southern border illegally rose to a historic monthly high of nearly 250,000 in December, before dropping dramatically to an average of about 134,100 per month in the first three months of 2024. Overall, apprehensions have been significantly higher under Biden than his predecessors, according to the latest data from U.S. Customs and Border Protection.
To even out the seasonal changes in border crossings, we compare the most recent 12 months on record with the year before Biden took office. And for the past 12 months ending in March, the latest figures available, apprehensions totaled 2,019,232, according to Customs and Border Protection. That’s 297% higher than during Trump’s last year in office.
Driving much of the increase has been an explosion in the number of migrants seeking asylum.
According to the Transactional Records Access Clearinghouse (TRAC) at Syracuse University, which collects and analyzes immigration data, the immigration court backlog rose to nearly 3.3 million cases by the end of 2023, more than three times higher than just four years prior. The result, immigration experts said, is that millions of migrants have been released into the U.S. pending court cases that may take years before they come before a judge.
In early February, a bipartisan group of senators unveiled the text of a proposed foreign aid and immigration overhaul bill. The $118 billion bill, called the Emergency National Security Supplemental Appropriations Act, sought significant changes in border policy. It included money to build more border barriers, to greatly expand detention facilities, and to hire more Immigration and Customs Enforcement and Border Patrol agents, asylum officers and immigration judges to reduce the yearslong backlog in cases to determine asylum eligibility. It sought to expedite the asylum process, essentially ending — in most cases — the so-called “catch and release” policy whereby migrants are released into the U.S. pending asylum hearings. And it would have increased the standard of evidence needed to win asylum status.
Biden threw his support behind the bill, but after Trump publicly opposed it — in part based on a distortion of what the bill would do — the bill failed in the Senate on Feb. 7. It was opposed by all but four Republicans and a few Democrats.
On Feb. 13, the Republican-led House voted to impeach Department of Homeland Security Secretary Alejandro Mayorkas, claiming that he had “willfully and systemically refused to comply with Federal immigration law.” The vote was 216-211, with every Democrat and one Republican opposing it. On April 17, the Senate voted along party lines to end the impeachment against Mayorkas.
Judiciary Appointments
Supreme Court — Biden has appointed one Supreme Court justice, Ketanji Brown Jackson, who replaced retired Justice Stephen G. Breyer, an appointee of President Bill Clinton. She was confirmed on April 7, 2022. Trump had won confirmation for two Supreme Court justices at the same point of his tenure.
Court of Appeals — Biden has won confirmation for 41 U.S. Court of Appeals judges. At the same point during Trump’s term, 51 had been confirmed.
District Court — Biden has won confirmation for 150 District Court judges, while Trump had won confirmation for 139 at the same point.
Four U.S. Court of Federal Claims judges have also been confirmed under Biden, while five had been confirmed at the same point of Trump’s presidency. Each man had won the confirmation for two U.S. Court of International Trade judges at this stage of their terms.
As of April 25, there were 42 federal court vacancies, with 12 nominees pending.
Gun Sales
The trend of Americans buying fewer guns appeared to continue in the first three months of 2024, according to background check figures reported by a gun industry trade group, the National Shooting Sports Foundation.
The NSSF estimates gun sales by tracking the number of background checks for firearm sales based on the FBI’s National Instant Criminal Background Check System, or NICS. The NSSF-adjusted figures exclude background checks unrelated to sales, such as those required for concealed-carry permits. We rely on these figures because the federal government doesn’t collect data on gun sales.
During the first quarter of 2024, the NSSF-adjusted NICS total for background checks was about 3.98 million — lower than the 4.17 million in the first quarter of 2023, and the lowest first quarter total since 3.41 million during the same period in 2019.
The three-month total so far this year is also about 29.2% lower than the nearly 5.63 million during Trump’s last quarter in 2020, which was a record year for background checks for firearm sales.
The NSSF stipulates that its adjusted NICS data is “not a direct correlation to firearms sales” — but does “provide an additional picture of current market conditions.”
Crude Oil Production and Imports
Last month, the Energy Information Administration reported that average crude oil production in the U.S. increased to roughly 12.92 million barrels per day during Biden’s most recent 12 months in office (ending in January). That was about 14.2% above the average daily amount of crude oil produced in 2020. And it’s higher than the pre-pandemic average in 2019.
EIA has said that oil production, despite declining drilling activity, has reached all-time highs during the Biden administration because new oil wells are more efficient.
“The number of new wells brought on line by drilling activity has historically been the key determinant of whether crude oil production increases or decreases,” the EIA said in a March analysis. “However, advances in horizontal drilling and hydraulic fracturing technologies have increased well productivity, enabling U.S. producers to extract more crude oil from new wells drilled while maintaining production from legacy wells.”
In its Short-Term Energy Outlook for April, the EIA projected that crude oil production will continue to break records. The agency expects production to reach 13.2 million barrels per day in 2024 and 13.7 million barrels a day in 2025.
Growth in crude oil production led the U.S. to export a record 4.1 million barrels of oil per day in 2023, the EIA said. But the U.S. is still importing more oil than it sends abroad.
In Biden’s last 12 months, the U.S. imported about 6.51 million barrels per day on average. That’s up almost 10.8% from average daily imports in 2020.
Carbon Emissions
After two consecutive years of increases, U.S. energy-related emissions from the consumption of coal, natural gas and various petroleum products fell in 2023 to about 4.81 billion metric tons. That total is about 4.9% more than 2020, but still about 6.6% less than in 2019, before the pandemic.
The EIA said emissions declined last year partially because of a reduction in electricity generated from coal-fired power plants, which was due to the increased use of solar power and other renewable energy sources. The agency said it expects CO2 emissions to remain “mostly unchanged” in 2024 before declining by 1% in 2025.
Home Prices & Homeownership
Home prices — After declining for seven consecutive months, home prices increased in February and again in March.
The preliminary median sales price of existing single-family homes in the U.S. was $397,200 in March — up from $388,000 in February, according to the National Association of Realtors.
“Frankly, it’s a great time to list, with ongoing multiple offers on mid-priced properties and, overall, home prices continuing to rise,” NAR Chief Economist Lawrence Yun said in an April 18 issue of Realtor Magazine.
The preliminary March figure is 29% higher than the $308,000 median home price in January 2021, when Biden took office. But it’s below the peak under Biden of $420,900 in June 2022.
Home prices began to fall last year in part due to rising mortgage rates. In its ongoing attempt to slow inflation, the Federal Reserve raised its benchmark rate in July for the 11th time since March 2022.
With inflation showing signs of cooling, Federal Reserve Chairman Jerome Powell indicated in December that the Fed may start cutting its rate. But recent inflation data have put the brakes on talk of rate cuts.
“The recent data have clearly not given us greater confidence and instead indicate that it’s likely to take longer than expected to achieve that confidence,” Powell said at a forum on April 16.
In our January report, we noted that the 30-year fixed rate mortgage average nationwide, as of Jan. 18, dropped to 6.6% — the lowest since May 2023, according to Freddie Mac. But 30-year mortgage rates, as of April 18, topped 7% for the first time this year, Freddie Mac reported in a recent press release.
Homeownership — Homeownership rates have barely budged under Biden.
The homeownership rate, which the Census Bureau measures as the percentage of “occupied housing units that are owner-occupied,” was 65.7% in the fourth quarter of 2023 — not much different than the 65.8% rate during Trump’s last quarter in office. (Usual word of caution: The bureau warns against making comparisons with the fourth quarter of 2020, because of pandemic-related restrictions on in-person data collection.)
The rate under Trump peaked in the second quarter of 2020 at 67.9%. The highest homeownership rate on record was 69.2% in 2004, when George W. Bush was president.